Ande Lloyd's Digital Portfolio
  • Home
  • Math 10
    • Math 10 Syllabus
  • Advanced Algebra
    • Advanced Algebra Syllabus
  • Rockets

Monday/Tuesday 2/28-29/22

2/28/2022

0 Comments


Objective

Create Infographics for the chi-squared project

Infographic Editing Resources

  1. Piktochart My recommendation for free online software to create an infographic
  2. Canva Another free infographic software to create an infographic.

Infographic Dos and Don'ts

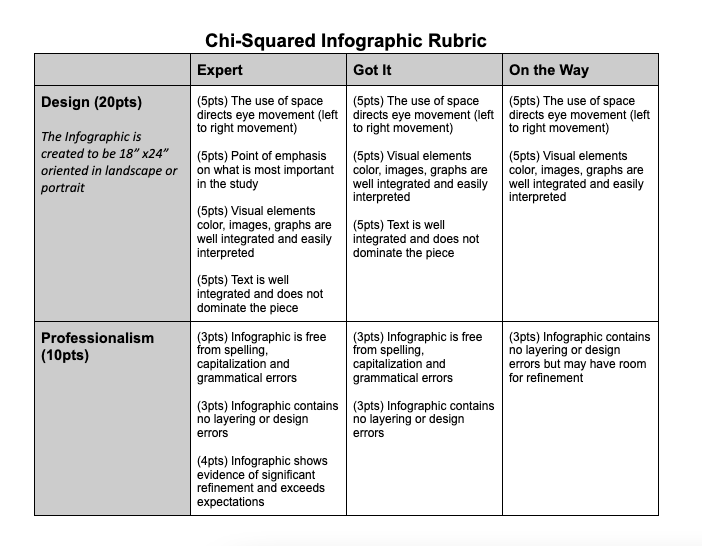
Infographic Criteria

Picture
Infographic Elements​
  1. Research Question  (point of emphasis)
  2. Background
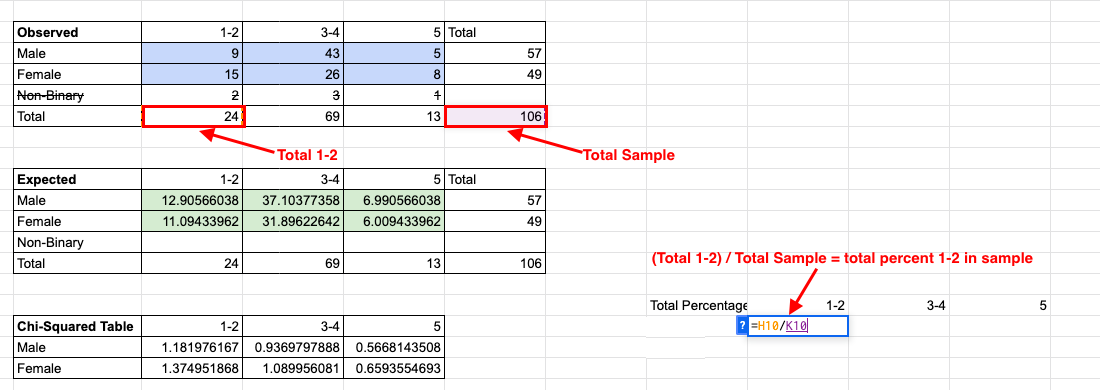
  3. Results: Observed and Expected Tables, Final Calculations
  4. Conclusion/Discussion
  5. References
0 Comments

Thursday/Friday 2/24-25/22

2/24/2022

0 Comments


Objectives

  1. Complete the background and Hypothesis for your write up
  2. Write the results and conclusion section for your rite up

Results and Conclusion

Results
  1. Read through the results sections for this example
  2. Use the rubric for the results section and highlight every criteria in the example that is outlined in the rubric. 
  3. Write your own results paragraph that summarizes the calculations from your study. You should not say any conclusions or if your numbers are significant, just summarize the numbers.

Conclusion/Discussion
  1. Read through the results sections for this example
  2. Use the rubric and identify the criteria in the paragraph 
  3. Write your own conclusion/discussion
0 Comments

Wednesday 2/23/22

2/23/2022

0 Comments


Objectives

  1. Finish all the calculations for the chi-squared project
  2. Start writing your background, and hypothesis 

Background, Hypothesis, and Research Question Steps

Research Question

  1. Write your research question at the top of your paper

Background

  1. Read the Background and Hypothesis for this example
  2. Use the rubric and grade this section of rubric
  3. Write your own background paragraph
  4. Use your prior research assignment to incorporate descriptive statistics into your background paragraph


Hypothesis

1. Find the total percentage for each category in your entire sample.
Picture
2. Incorporate these total percentages into your null hypothesis. This will make your null fairly long but that is ok.

3. Write your alternative hypothesis


0 Comments

Tuesday 2/22/22

2/21/2022

0 Comments


Objective

  1. Finish observed and expected tables
  2. ​Complete chi-squared calculations

Chi-Squared Calculations

  1. Open your spreadsheet with your calculations for your data
  2. Create a Chi-squared Table that matches the number of colored cells for your observed and expected tables
  3. Use the chi-squared formula and find the chi-squared for each of your data data points
  4. Create a final calculations table with Final Chi-Squared, Critical Value, P-value
  5. Take the sum of each individual chi-squared in the “Final Chi-Squared” cell
  6. Find the Degree of Freedom for your data. DF = (n-1)*(n-1) from your expected table. 
  7. Use this table to find the critical value for your data. Input the appropriate critical value in your table. 
  8. Calculate the p-value by typing "=CHISQ.TEST(" then selecting the observed values, and the expected values
0 Comments

Thursday 2/17/22

2/17/2022

0 Comments


Objectives

  1. Gather data for the seniors
  2. Complete the observed and expected tables for your data

Observed and Expected Tables

Steps

  1. Open the Math 10 Chi-Squared Survey Results
  2. Watch the video above for a detailed step by step.
  3. Highlight both your group and your metric in the master spreadsheet
  4. Copy and paste your group and your metric into a new spreadsheet
  5. Title your spreadsheet as “Chi-squared Calculations Name”
  6. Clean up necessary responses
  7. Sort your group A-Z (see video for how)
  8. Make a count table for your metric (see video for how)
  9. Make an observed table
  10. Make an expected table
0 Comments

Wednesday 2/16/22

2/16/2022

0 Comments


Objectives

  1. Collect data by surveying the entire school
  2. ​Complete the prior research assignment

Starter

Math 10 Chi-squared Survey

Calendar

Picture

Prior Research Activity

This is your task if you are not actively collecting data from the school. Go to the Prior Research Activity, also found on google classroom. 
  1. Find 3 sources that give background information about your group or metric. The sources must be from a reliable source (.org websites, academic articles, scientific journals, ect)
  2. Copy the links onto your document
  3. Use Purdue Owl and create an MLA citation for your source. 
0 Comments

Tuesday 2/15/22

2/15/2022

0 Comments


Objective

  1. Compile and organize all research questions
  2. Write the all school survey​
Picture

Research Activity

Find the Research Questions Activity we worked last Thursday.

Pick 3 groups and 3 metrics, and write 3 different research questions following this format:
“Is there a difference between __”group”__ with respect to ___metric___?”  

Sticky Notes:

​Out of the 3 research questions, pick the one that is most interesting to you. 
  1. Write it on a sticky note and pass it to your partner. 
  2. On your partner’s sticky note bullet point the metric and the group
  3. On the poster on your table, organize all the sticky notes by group, and title the group clearly on the poster. 
  4. On an empty space on the poster list all the metrics from the questions. Clearly write it so it is visible from a little ways away. ​

Creating the Survey

  1. Open the Math 10 Statistics Survey
  2. Create a question for your group if it has not already been asked
  3. Create a question for your metric if it has not already been asked
  4. Cross off your group and metric on the whiteboard
0 Comments

Tuesday 2/8/22

2/8/2022

0 Comments


Objective

Learn how to find the expected values using a chi-squared table

What to Expect Assignment

Picture
Directions:
  1. Grab both page 1 and 2 for the What to Expect Assignment and stable them together
  2. Find the null hypothesis for #1
  3. (As a Class) Fill out the table for #2
  4. Complete problem 3-5 today
0 Comments

Monday 2/7/22

2/4/2022

0 Comments


Objectives

  1. Model the dice data using a normal distribution
  2. Conclude whether or not there is a difference between virtual and physical dice using chi-squared

Dice Experiment Part 2

Directions
  1. Open your spreadsheet you made the day before, and copy your dice data for both physical and and virtual into the Master Spreadsheet.
  2. Make a copy of the master spreadsheet. 
  3. Follow the instructions on Chi-Squared Dice Experiment Part 2
  4. Answer the questions on Chi-Squared Dice Questions Part 2 (physical)

Due Dates

  1. Dice Experiment Part 1 (Due Friday 2/4/22 at the end of class)
  2. Dice Experiment Part 2 (Due Today 2/7/22 at the end of class)
0 Comments

Thursday 2/3/22

2/3/2022

0 Comments


Objectives

  1. Collect data on real vs virtual dice using spreadsheets
  2. Run Chi-squared calculations using spreadsheets

Chi-Squared Dice Experiment Part 1

Directions:
  1. Open the Chi-Squared Dice Experiment Part 1 document
  2. Build your data set by rolling 50 times each, the virtual dice found here, and the real dice which will be given to you. 
  3. Follow the instructions on the Chi-Squared Dice Experiment Part 1 document to build out your calculations. 
  4. Fill out the Chi-Squared Dice Questions Part 1 (virtual) and turn in on GC when done
0 Comments
<<Previous

    Archives

    October 2024
    September 2024
    August 2024
    April 2024
    March 2024
    February 2024
    January 2024
    December 2023
    November 2023
    October 2023
    September 2023
    August 2023
    May 2023
    April 2023
    March 2023
    February 2023
    January 2023
    December 2022
    November 2022
    October 2022
    September 2022
    August 2022
    March 2022
    February 2022
    January 2022
    December 2021
    November 2021
    October 2021
    September 2021
    August 2021

    Categories

    All

    RSS Feed

Powered by Create your own unique website with customizable templates.
Photo from osiristhe